Frankie Fischer · 9 October 2026
Shifting Local Economies Reshape School District Funding Patterns Across Regions
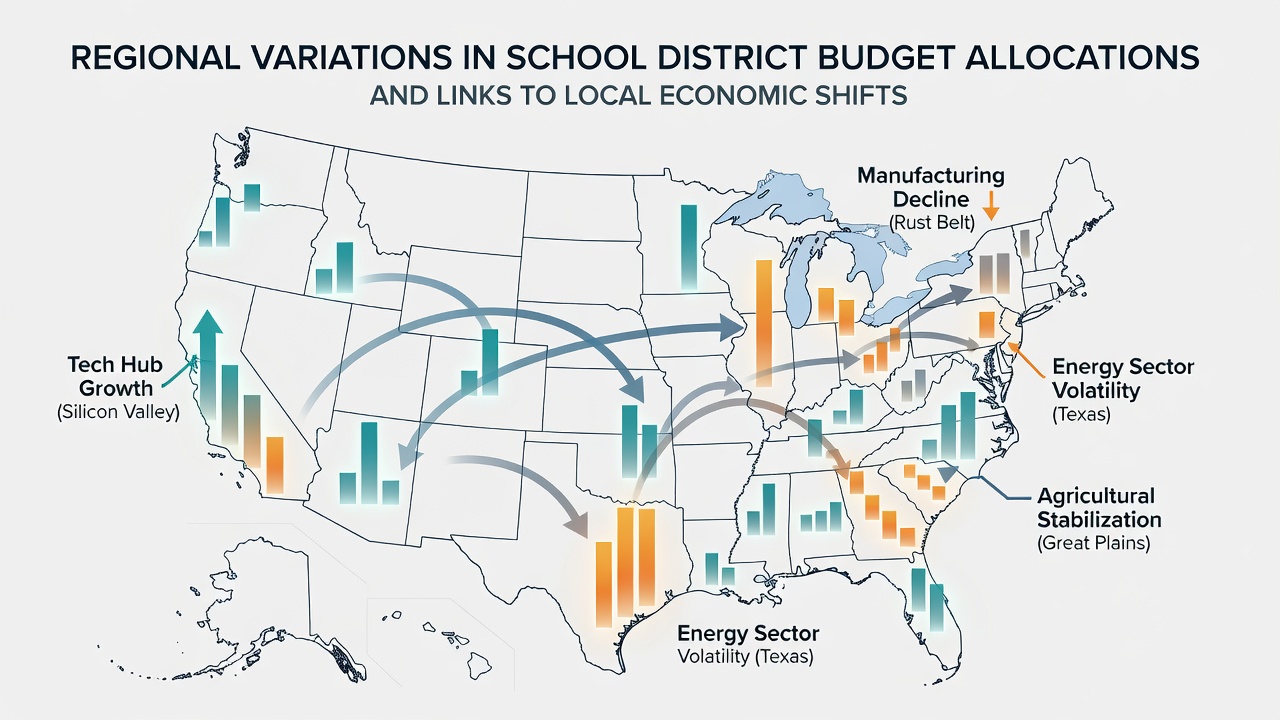
School district budgets across the United States display marked regional differences that align closely with local economic conditions, and data from federal sources track these patterns through property tax revenues, state aid formulas, and enrollment shifts. Property taxes supply the largest share of local education funding in most districts, which means fluctuations in housing values, employment sectors, and business activity translate directly into spending capacity for classrooms and facilities.
Property Tax Reliance Creates Regional Divergence
Districts in areas experiencing industrial growth often see rising assessed property values that boost per-pupil allocations, whereas regions facing manufacturing declines record slower revenue growth even when state formulas attempt to offset gaps. According to U.S. Census Bureau education finance reports, the share of total K-12 revenue derived from local sources ranged from 35 percent in the South to over 55 percent in parts of the Northeast and Midwest during recent fiscal years. These percentages reflect longstanding differences in tax structures and economic bases rather than policy preferences alone.
Observers note that energy-producing counties in Texas and North Dakota recorded above-average increases in local education revenue between 2018 and 2025, driven by new commercial properties and higher home values tied to workforce expansion. In contrast, districts in former coal regions of Appalachia continued to rely more heavily on state supplemental funds as property assessments stagnated. Enrollment declines in rural Midwest counties further compound budget pressure because state aid formulas frequently tie portions of funding to student counts.
Data Trends Through 2026
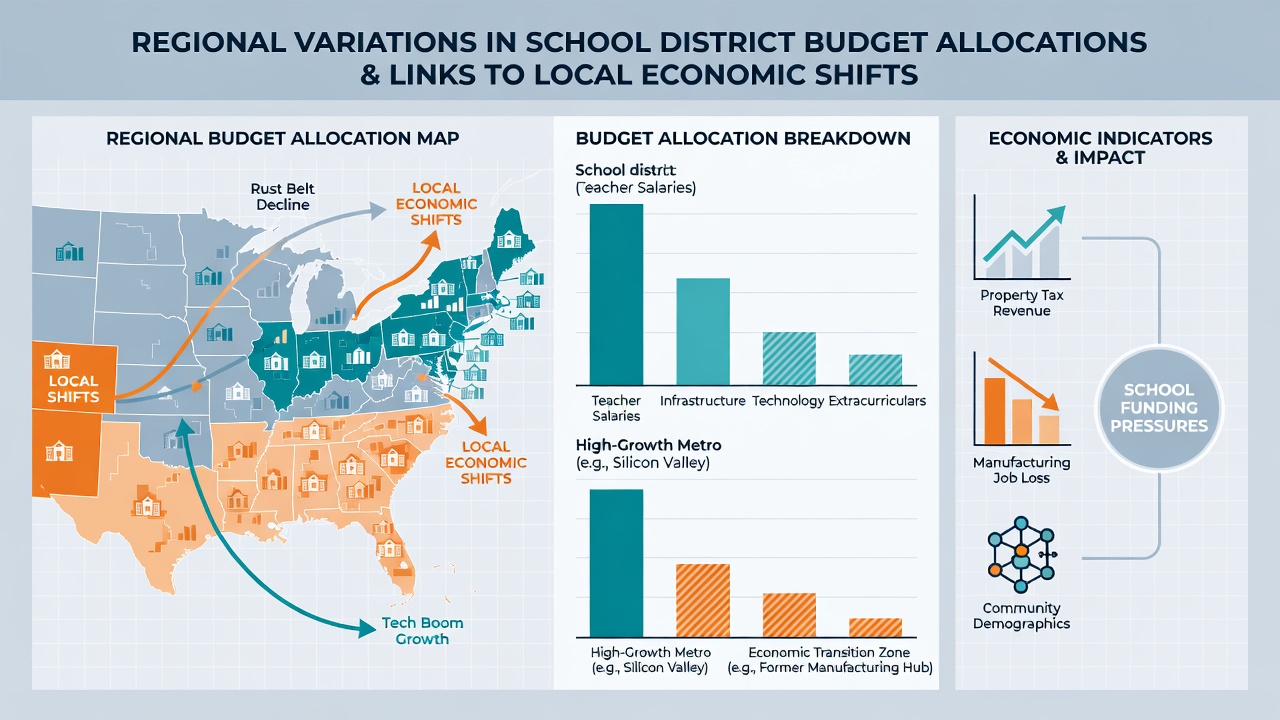
National figures compiled by the National Center for Education Statistics show that total per-pupil spending reached $16,280 in the 2024-2025 school year, yet the range across states extended from roughly $11,000 to more than $24,000. October 2026 updates from the same agency indicate that states with strong technology and finance sectors maintained higher local contribution rates, while states with larger agricultural and service economies leaned more on state and federal transfers. These patterns hold after controlling for cost-of-living adjustments in several longitudinal studies.
Researchers tracking county-level economic indicators alongside district budgets find consistent correlations between median home values and instructional spending per student. Areas that added logistics and distribution centers saw faster growth in maintenance budgets and technology purchases compared with counties that lost retail employment. The links appear strongest where local taxes constitute more than half of district revenue.
Case Examples From Different Regions
Take one suburban county outside Seattle where software industry expansion lifted property assessments by double-digit percentages over five years; district records show corresponding rises in capital project funding without increases in state aid shares. Meanwhile, a manufacturing-heavy county in Ohio experienced flat local revenue and responded by consolidating administrative positions and extending the life of existing textbooks. Both examples illustrate how economic activity at the county level shapes day-to-day resource decisions.
Similar contrasts appear in Sun Belt states experiencing population inflows. Districts in central Florida and central Texas posted enrollment gains that triggered additional state per-pupil dollars, yet local tax revenue growth varied according to the pace of commercial development near new housing subdivisions. Analysts at university research centers have documented that rapid enrollment growth without matching commercial property additions can strain operating margins even when total revenue rises.
State Aid Formulas and Their Regional Effects
State funding formulas attempt to moderate these differences through foundation grants, weighted student counts, and hold-harmless provisions. Data indicate that states with more progressive aid structures reduce the spending gap between high- and low-property-wealth districts by 20 to 30 percent on average. Nevertheless, the remaining variation still tracks local economic performance because districts retain authority over supplemental levies and because economic shifts influence the total pool of taxable resources.
Canada's provincial education funding models offer a comparative lens, with British Columbia and Ontario directing larger shares of revenue through centralized grants that respond to regional economic indicators such as resource sector output. Australian states apply similar needs-based adjustments tied to remote community economic profiles. These international approaches highlight that the United States reliance on local property taxes amplifies the connection between economic conditions and school budgets.
Conclusion
Regional variations in school district budget allocations continue to mirror local economic shifts through property tax mechanisms, enrollment dynamics, and state response formulas. Federal statistics through October 2026 confirm that districts located in expanding economic zones maintain higher discretionary spending, while areas undergoing contraction depend more on external transfers. These patterns emerge consistently across data sets that pair economic indicators with education finance reports, underscoring the structural ties between community economic health and school resource availability.